

Every year, global financial markets begin January with a familiar ritual. Investors examine the first movements of major indices and once again recall an old but persistent market concept known as the “January Barometer”. Some treat it as a harmless market tradition, others as a useful reference point for understanding how the market enters a new year. But if we strip away the mystique, a rational core remains: January often acts as the first real stress test for risk appetite, interest rate expectations and investor confidence, DKNews.kz reports.
According to Tural Aliyev, analyst at Freedom Finance Global, the true value of the January Barometer lies not in prediction, but in interpretation.
“January is the first full snapshot of investor sentiment after portfolios have been rebalanced, capital reallocated and macroeconomic expectations revised. It reflects the initial balance between willingness to take risk and the desire for protection,” Aliyev explains.
Where the January Barometer Comes From
The idea that January may carry special meaning for financial markets emerged long before modern quantitative models became widespread. Since the early 1970s, financial media have repeatedly noted a simple observation: a strong January often precedes a favorable year, while a weak start tends to coincide with higher volatility and more cautious investor behavior.
Over time, this observation became embedded in market tradition. Importantly, however, it was never intended as a trading rule. Instead, it evolved into a contextual indicator used to assess expectations rather than to make buy or sell decisions.
How the January Barometer Differs from the January Effect
One of the most common mistakes is confusing the January Barometer with the classic January Effect.
- The January Effect refers to higher average returns of individual stocks, particularly small-cap companies, during January.
- The January Barometer, by contrast, looks at the market as a whole and attempts to link January’s overall performance with the trajectory of the rest of the year.
In other words, this is not a seasonal anomaly in specific securities, but a broader indicator of market sentiment and risk tolerance.
What Academic Research Has Shown
The most comprehensive academic examination of the January Barometer was conducted by Michael Cooper, John McConnell and Alexei Ovchinnikov. In a study covering the period from 1940 to 2003, the authors demonstrated a statistically significant relationship between January market returns and returns over the subsequent eleven months.
Their findings were consistent:
- Following a positive January, the market on average delivered substantially stronger results.
- After a negative January, performance tended to be weaker and investor caution more pronounced.
- The difference between these scenarios was not only statistically significant, but economically meaningful.
Crucially, the relationship persisted even after controlling for macroeconomic indicators, business cycle phases, political factors and measures of investor sentiment. The effect was observed across large and small companies alike, as well as growth and value stocks.
A notable exception was the period 1929–1939, when the extreme conditions of the Great Depression disrupted many historical patterns.
What January Actually “Measures”
It is essential to understand that January is not the cause of future returns. Rather, it reflects investors’ initial positioning at the start of the year.
Several key processes converge in January:
- portfolio rebalancing and risk reassessment,
- revisions of interest rate and inflation expectations,
- updated forecasts for corporate earnings,
- evaluation of return concentration in large-cap leaders.
As a result, January captures the baseline equilibrium between risk appetite and defensive positioning. If external conditions remain relatively stable, this balance can persist throughout much of the year.
Why the January Barometer Is Not a Causal Signal
Despite its statistical consistency, the January Barometer lacks a clear theoretical mechanism that would make it a causal driver of market performance. Academic authors themselves emphasize that the phenomenon reflects correlation, not causation.
There is also the possibility that part of the effect stems from long-term coincidence reinforced by market narrative and tradition. For this reason, treating the January Barometer as a standalone forecast tool would be misguided.
Comparison with Other Calendar Indicators
Alongside the January Barometer, markets often reference other calendar-based indicators, such as the “first five trading days” rule or various short-term composites. However, empirical evidence suggests that these shorter indicators have weaker predictive power, particularly in years that begin negatively.
From this perspective, January as a full month provides more meaningful information about market sentiment than a handful of early trading sessions.
Why the Classic January Effect Has Weakened
Modern research and market data show that the traditional January Effect has significantly weakened since the early 2000s. Structural changes in markets have played a key role:
- the rise of passive investing,
- widespread adoption of ETFs,
- increased dominance of large technology companies.
As a result, seasonal anomalies have become less pronounced, and performance differences between months have narrowed.
How Investors Use the January Barometer Today
Today, the January Barometer is primarily used as a contextual indicator. It helps investors:
- gauge overall market sentiment at the beginning of the year,
- align that sentiment with macroeconomic conditions and central bank policy,
- assess whether the market is entering the year in a “risk-on” or “risk-off” mode.
January does not provide definitive answers, but it often offers the first clear signal of the market’s prevailing regime.
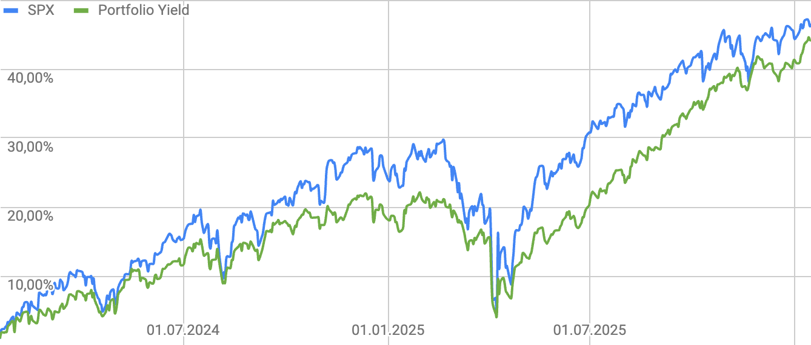 Portfolio performance and relative strength vs. the S&P 500 over the past two years. Source: Google Finance, Freedom Broker.
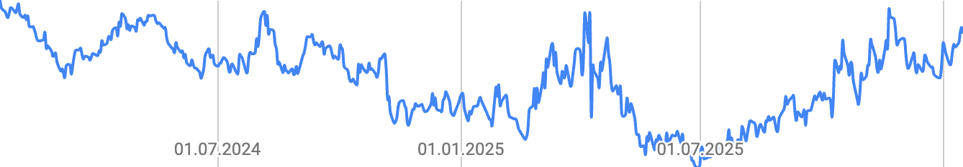 Portfolio relative strength against the S&P 500. Source: Google Finance, Freedom Broker.
Companies and Instruments Worth Watching
According to analysts, a balanced portfolio is typically built from a diversified mix of large-cap equities and blue-chip stocks, complemented by growth sectors and bond ETFs.
Such a portfolio focuses on financial market instruments, including large- and mid-cap equities as well as exchange-traded funds. The recommended investment horizon ranges from six months to three years. Risk management is achieved through limits by asset class, sector, capitalization and investment style.
Portfolio performance and relative strength versus the S&P 500 over the past two years. Source: Google Finance, Freedom Broker.
Core Equity Positions
- Microsoft Corporation – strong growth in cloud solutions and artificial intelligence, high profitability and predictable corporate revenues. Growth potential: 35%. Risks: slowing cloud growth and rising capital expenditures.
- Taiwan Semiconductor Manufacturing Company (TSMC) – leader in advanced semiconductors and a key supplier for computing and artificial intelligence, with high technological barriers to entry. Growth potential: 17%. Risks: geopolitics and semiconductor cyclicality.
- Apple Inc. – stable ecosystem cash flows, growing services revenue and large-scale share buybacks. Growth potential: 17%. Risks: smartphone market saturation and regulatory pressure.
- Alphabet Inc. – dominance in digital advertising, strong balance sheet and growing contribution from cloud services. Growth potential: 12%. Risks: competition from AI-based search and antitrust cases.
- Mastercard Incorporated – structural growth of cashless payments, high margins and a low-capital-intensity business model. Growth potential: 22%. Risks: regulation of fees and slowing consumer demand.
- Amazon.com, Inc. – improving profitability driven by cloud services and advertising at scale. Growth potential: 24%. Risks: rising capital investment and slower cloud growth.
Defensive and Balancing Instruments
SPDR Gold Trust – a defensive asset used to reduce portfolio risk in an unstable macroeconomic environment. Growth potential: 7%. Risk: rising real interest rates.
iShares 20+ Year Treasury Bond ETF – capital protection and exposure to declining interest rates. Growth potential: 12%. Risk: inflationary pressures.
Final Thoughts
Early January market movements are shaped less by seasonal effects and more by reassessments of interest rate expectations, economic resilience and the concentration of returns in large-cap leaders.
Historically, meaningful conclusions from the January Barometer can only be drawn at the end of the month. It does not predict the market in a strict sense and cannot replace fundamental analysis. However, it often serves as the first indicator of how investors perceive risk and opportunity as a new year begins. Its value lies not in promising returns, but in helping investors understand the mindset with which the market enters the year.